

Posted by Megan Oldcorn
Google Analytics is a valuable tool for gauging the success of your website, along with its strengths and weaknesses.
But with so many options and so much data to choose from, for the uninitiated it can feel overwhelming. Here, we set out a basic user’s guide to Analytics, and some of the key ways in which it can be helpful.
What am I looking at?
After logging in, you’ll enter at the Home page, which shows overview data for your website.
On the left-hand side of the screen, you’ll see various options.
- Real time shows what’s happening on the site right now, including visitor numbers, visitor locations and which pages they’re on.
- Audience offers more information about the website’s performance, including user numbers, sessions per user, pages per session, and bounce rate. Within this section, there are also other sub-sections that explore topics in more detail, such as mobile users and geographic data.
- Acquisition breaks down how visitors were ‘acquired’ by the site, whether from social activity, search, paid advertising, referral, email, or by directly entering the URL into their browser.
- Behaviour considers how users behave with the site after they arrive: which pages they view, in which order, where they leave, and so on.
- Conversions allows you to set up goals and multi-channel funnels to review success.
Date ranges
As a default, most pages will display data for the past month. To change the period viewed, go to the date range shown just below the top right-hand corner, and select from the various options offered, or manually enter a specific period.
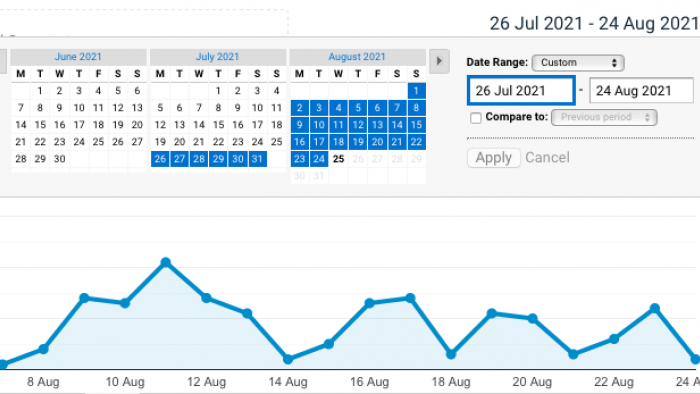
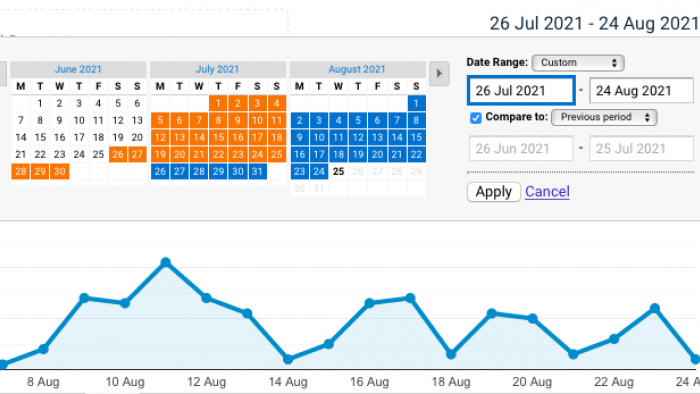
If you’d like to compare one period with another, check the ‘Compare to’ box and enter your comparison date. Unless you’re assessing the success of a specific week-on-week campaign (or similar), we usually recommend comparing the period with the same period in the previous year, to avoid data being skewed by seasonal events and fluctuations.
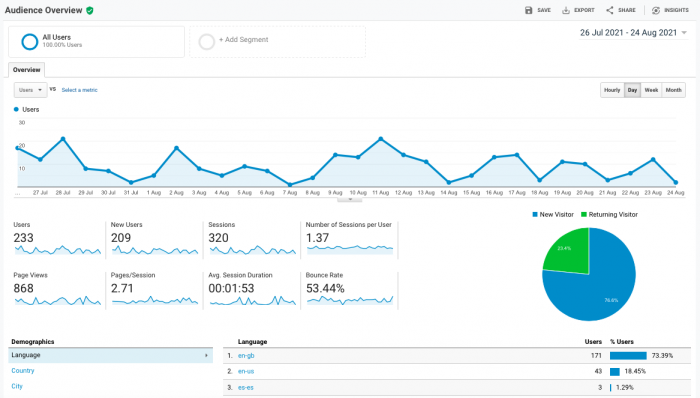
Audiences
The Overview data shown within this section can be very useful for gaining a ‘snapshot view’ of your website’s health and performance.
Things to consider:
- Sessions: this figure shows the number of individual visits to your website during your set period (as mentioned above, this is usually the past month).
- Page views: this shows the total number of individual pages viewed by all users during all website sessions (for the period indicated).
- Users and new users: ‘users’ indicates the total number of people who used the site during the period, whereas ‘new users’ specifically counts those for whom this was their first visit. If you’re an ecommerce site that relies on a high percentage of repeat custom, a high proportion of returning visitors and lower ‘new user’ numbers will be expected. If you’re trying to break into new audiences, you might like to consider whether the ‘new user’ figure is rising as hoped.
- Bounce rate: the percentage of single-page sessions that occurred on the site. This means that a user has entered a page, not interacted with it, and exited again. Generally, a lower bounce rate is considered better, but this is not a precise rule – if a user needs to find just one thing (e.g. your telephone number, in order to make a call), and is able to immediately achieve this, the bounce is actually desirable.
- Avg. session duration: as with the bounce rate (above), this depends on what a user is attempting to achieve by visiting your site. A low figure may not be wrong if you’re prompting visitors to call you, but a higher figure generally shows greater engagement with your content.
Acquisition
It’s useful to know where your users are coming from, and how they’re being directed to your website. The Acquisition Overview section will show top-level statistics that are useful at a glance, such as the percentage of people that are arriving due to social media activity.
To consider each source (social, Google ads, and so on) in more detail, you can click into the sub-sections within Acquisition.
- The ‘Search console’ sub-section shows which pages are the most popularly found by search engine users, and which ‘Queries’ (search terms) they’re using to find you. This can be very helpful when reviewing the success of SEO, planning new keywords to target, or considering topics for future content.
- The ‘Social’ sub-section offers more detail on social media referrals, including specific platforms. This can be helpful when reviewing the success of social media activity and campaigns.
Behaviour
This section offers more detail about how users behave on the website. The Overview sub-section contains key details such as the average time on each page, and the total number of page views. On the lower right-hand side, you’ll also be able to see a list of the top 10 pages on your site (or click ‘view full report’ beneath this to see all pages).
To find out more about how a specific page is faring, click into its URL within the Overview ‘Top 10’ list, or alternatively go to the ‘Site Content’ sub-section within Behaviour, and find it within ‘All Pages’. This will take you to a breakdown of data for this page only – allowing you to view things like the ‘Exit’ rate (how many people leave the site after viewing this page) and bounce rate.
If you’d like to compare the success of a particular ‘group’ of pages, such as blog articles or products, go to the ‘Site Content’ sub-section within Behaviour, and click on ‘All Pages’. At the top of the data table, you’ll see a small search bar indicated by a magnifying glass. In this bar, type the relevant partial URL, such as /shop. The table will then display only pages that contain this URL segment, making it easier to compare them.
Conversions
The Conversions section is arguably one of the most interesting and important when it comes to tracking the success of your website. This allows you to set ‘Goals’ for the site (such as bookings, enquiries or sales), with a set method of measuring achievement (such as a click onto a ‘thank you’ page).
Setting up Goals is a little more involved than working in the other tabs, making it a definite ‘stage two’ in a beginner’s journey. If you’d like to give it a go, take a look at this guide by Google Support.
Need Analytics support?
If you’re keen to find out more about how your website is faring – or if you’re worried about your findings – get in touch.